All workspaces
The All workspaces page compares cost, reviews and findings across every workspace you belong to, on one screen. Use it to see where money goes, which teams use Gryndel most, which workspaces have trouble, and how many repositories Gryndel has learned. Every other page shows one workspace at a time.
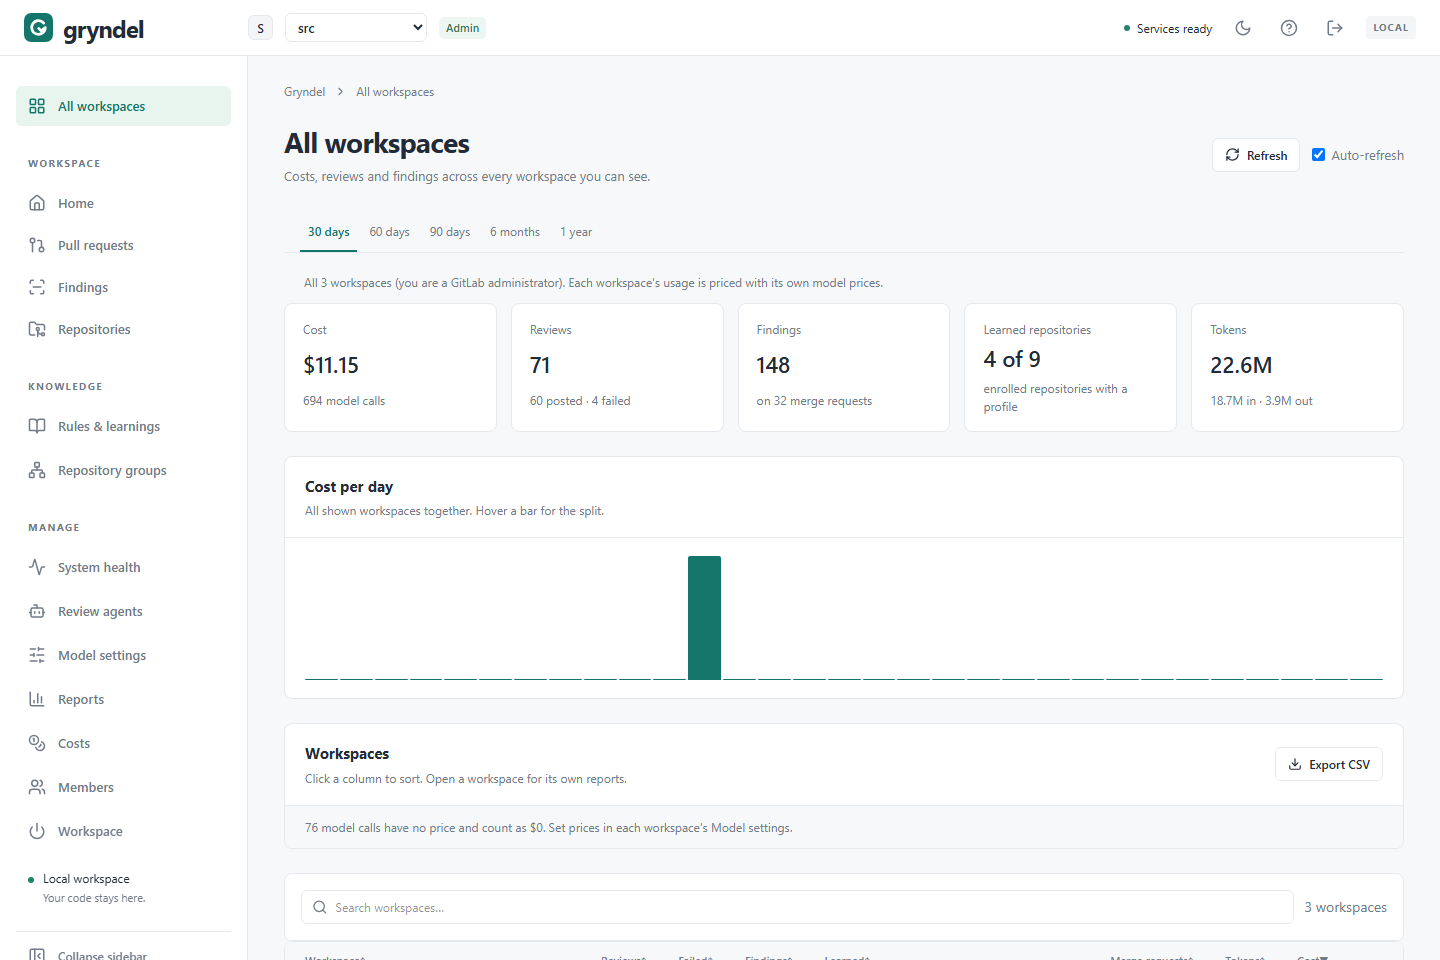
Click All workspaces at the top of the sidebar, above the WORKSPACE section.
Who sees what
Anyone signed in can open this page. It shows:
- The workspaces you belong to, whether you're an admin or a viewer there. A line under the period tabs says how many, for example "The 3 workspaces you belong to."
- For GitLab administrators, every workspace on the server, including ones they don't belong to, and including GitHub workspaces. The line then says "All n workspaces (you are a GitLab administrator)."
A sign-in belongs to one code host, so everyone else sees only the workspaces on the host they signed in with: GitLab groups after Sign in with GitLab, GitHub accounts after Sign in with GitHub. Only a GitLab administrator sees both hosts on one page. Anyone else who works on both signs in with each host in turn and exports each one's numbers (see Export to a spreadsheet).
When to use it
| Question | Where to look |
|---|---|
| Which team spends the most on models? | The workspace table, sorted by Cost (the default order). |
| Is spending growing? | Cost per day (or per week), over 90 days or longer. |
| Which model costs the most, across teams? | Models that cost the most. |
| Is a team's Gryndel healthy? | Failed compared with Reviews in the workspace table. |
| Which teams haven't learned their repositories yet? | The Learned column. |
| I need the numbers in a spreadsheet or for a monthly report | Export CSV. |
To dig into one workspace, click its name. Gryndel switches to it and opens its home page. Its Reports and Costs pages have the details.
Choose a period
The tabs at the top are 30 days, 60 days, 90 days, 6 months and 1 year, counted back from now. Every section of the page follows the chosen period, except the repository counts, which are always today's.
Read the totals
| Card | What it shows |
|---|---|
| Cost | Total model cost in US dollars, and the number of model calls. |
| Reviews | Reviews started in the period, and how many of them posted their results and how many failed. |
| Findings | Findings posted, and on how many merge or pull requests. The card says "merge requests" even for GitHub workspaces. |
| Learned repositories | Enrolled repositories that have a repository profile, out of all enrolled repositories. |
| Tokens | Tokens sent to models (in) and written by them (out). |
Some things to know when reading them:
- Reviews counts every review Gryndel started, including ones that were skipped, cancelled or replaced by a newer commit. So posted and failed don't add up to the total.
- A finding is counted once per review that found it. If the same problem is still there after a new push, it's posted again on the new commit and counted again.
- Cost includes every model call, not just reviews:
@gryndel check,explainand questions, and learning repositories also use the model. - Each workspace's usage is priced with that workspace's own prices, as set in its Model settings. Model calls with no price count as $0. When some exist, a note above the table says how many, for example "12 model calls have no price and count as $0." Add the missing prices in each workspace to make the totals complete.
Cost per day
The chart shows the cost of all shown workspaces together, one bar per day. For periods longer than 90 days each bar is a week. Hover over a bar to see its date, total, and how it splits between workspaces. If nothing was priced in the period, the chart says No priced model calls in this period.
The workspace table
| Column | What it shows |
|---|---|
| Workspace | Name, GitLab group path or GitHub account name, number of enrolled repositories, your role (Admin, Viewer or not a member), and the date of the last review. An Off badge means reviews are turned off there. |
| Reviews | Reviews started in the period. |
| Failed | Reviews that failed. |
| Findings | Findings posted. |
| Learned | How many enrolled repositories have a profile, such as "2 of 5", and the first few names. Hover to see all of them, with when each was learned. |
| Merge requests (Pull requests for GitHub sign-ins) | Merge or pull requests with at least one review in the period. |
| Tokens | Input and output tokens together. |
| Cost | Cost in US dollars, with a bar comparing it with the most expensive workspace. |
The table starts with the most expensive workspace. Click a column heading to sort by it. Search workspaces filters by name, group path or account name, role, "off", or a learned repository's path.
You can only open workspaces you're a member of. GitLab administrators see other workspaces' names in plain text, not as links.
What to do about what you see:
| You see | Look at |
|---|---|
| Many Failed reviews | The failed reviews on that workspace's Pull requests page, for the error. Often it's the model provider. See Troubleshooting. |
| A workspace costs much more than others | Its Costs page, by model. Check its review mode and the model it uses. |
| Learned is low | Admins can learn repositories so reviews know each codebase. |
| An Off badge you didn't expect | That workspace's Workspace page says who turned it off, and when. |
Export to a spreadsheet
When: for a monthly cost report, a chargeback to each team, or to compare periods in a spreadsheet.
- Choose the period.
- Click Export CSV above the workspace table.
Your browser downloads a file named after the period, such as gryndel-workspaces-30d.csv
or gryndel-workspaces-365d.csv. It has one row per workspace shown, whatever you typed
in Search workspaces. Every value is quoted, so it opens cleanly in Excel, Google Sheets
or LibreOffice.
| Column | Contents |
|---|---|
workspace, group | Name, and GitLab group path or GitHub account name. |
state | on or off. |
reviews, posted, failed | Reviews started, posted and failed. |
findings, merge_requests | Findings posted, and merge or pull requests reviewed, in the period. The column keeps this name for GitHub workspaces. |
repositories | Enrolled repositories today. |
learned_repositories | Paths of learned repositories, separated by ; . |
model_calls, input_tokens, output_tokens | Model usage. |
cost_usd | Cost in US dollars, to six decimal places. |
last_review | When the last review in the period started, as an ISO 8601 date and time. |
Tip: to compare months, export 30 days at the start of each month and keep the files. The page always counts back from today, so you can't pick a past month directly.
Models that cost the most
The last table lists up to 15 provider and model pairs across the shown workspaces, most expensive first: how many workspaces used each, its calls, tokens and cost. Providers are shown by the name each workspace gave them. Use it to spot an expensive model that one team could swap for a cheaper one in its Model settings.